Webhook Analytics
Webhook Analytics reports whether the webhook system is working, across every subscription. It answers the question a partner integration raises first: are events being delivered, and if not, where are they stuck?
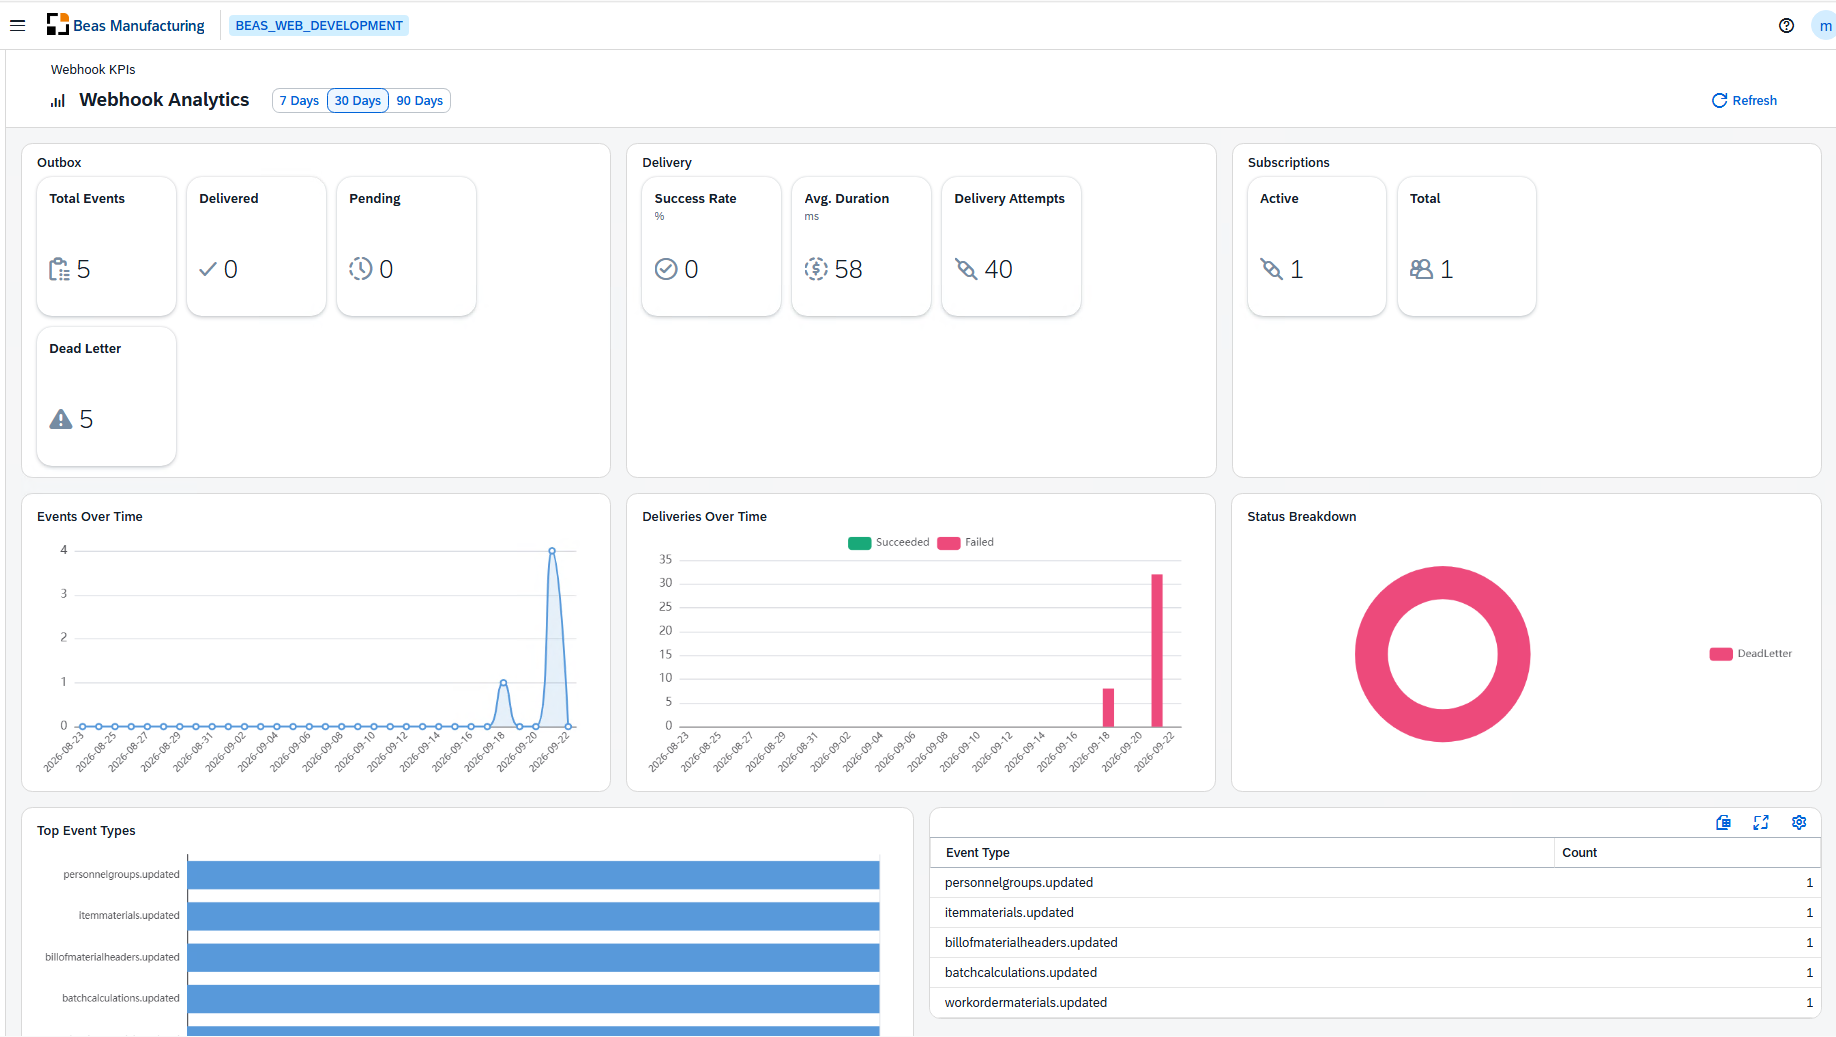
Outbox · Delivery · Subscriptions
The headline figures, in three groups.
Outbox
| Field | Description |
|---|---|
| Total Events | Events raised. |
| Delivered | Events delivered. |
| Pending | Events still waiting. |
| Dead Letter | Events that ran out of attempts. |
Delivery
| Field | Description |
|---|---|
| Success Rate | Share of deliveries that succeeded. |
| Avg. Duration | How long a delivery takes on average. |
| Delivery Attempts | Attempts made in total. |
Subscriptions
| Field | Description |
|---|---|
| Active | Subscriptions currently switched on. |
| Total | Subscriptions defined. |
Events Over Time · Deliveries Over Time
Two charts over the same period: what was raised, and what was delivered. They diverge exactly where a problem started.
Status Breakdown
How the events divide between delivered, pending and dead letter — the shape behind the success rate.
Top Event Types
Which events dominate the traffic. Useful before adding a subscription: a group that fires constantly is a group worth subscribing to narrowly.
Subscription Health
One row per subscription, which is where a single bad endpoint shows up.
| Column | Description |
|---|---|
| Name | The subscription. |
| Total | Events raised for it. |
| Delivered | Events delivered. |
| Pending | Events still waiting. |
| Dead Letter | Events that ran out of attempts. |
| Success Rate % | Its own success rate. |
| Avg (ms) | Its average delivery time. |
| Last Event | When it last received something. |
Examples
A good overall success rate hiding a broken endpoint. The headline Success Rate averages every subscription together. Read Subscription Health instead: one endpoint at 0% among nine healthy ones barely moves the average, and it is the one somebody is waiting on.
Deliveries slower than the events arriving. When Events Over Time climbs and Deliveries Over Time does not follow, the queue is growing. Pending and Avg. Duration together say whether the endpoint is slow or simply not answering.