Product Cost
The Product Cost page shows what one item costs to produce according to the last calculation run for it: the total, how that total splits into material, labor and overhead, how it compares to what the item actually cost in SAP, and which components and operations drive it. From here you can also run a new calculation for the item.
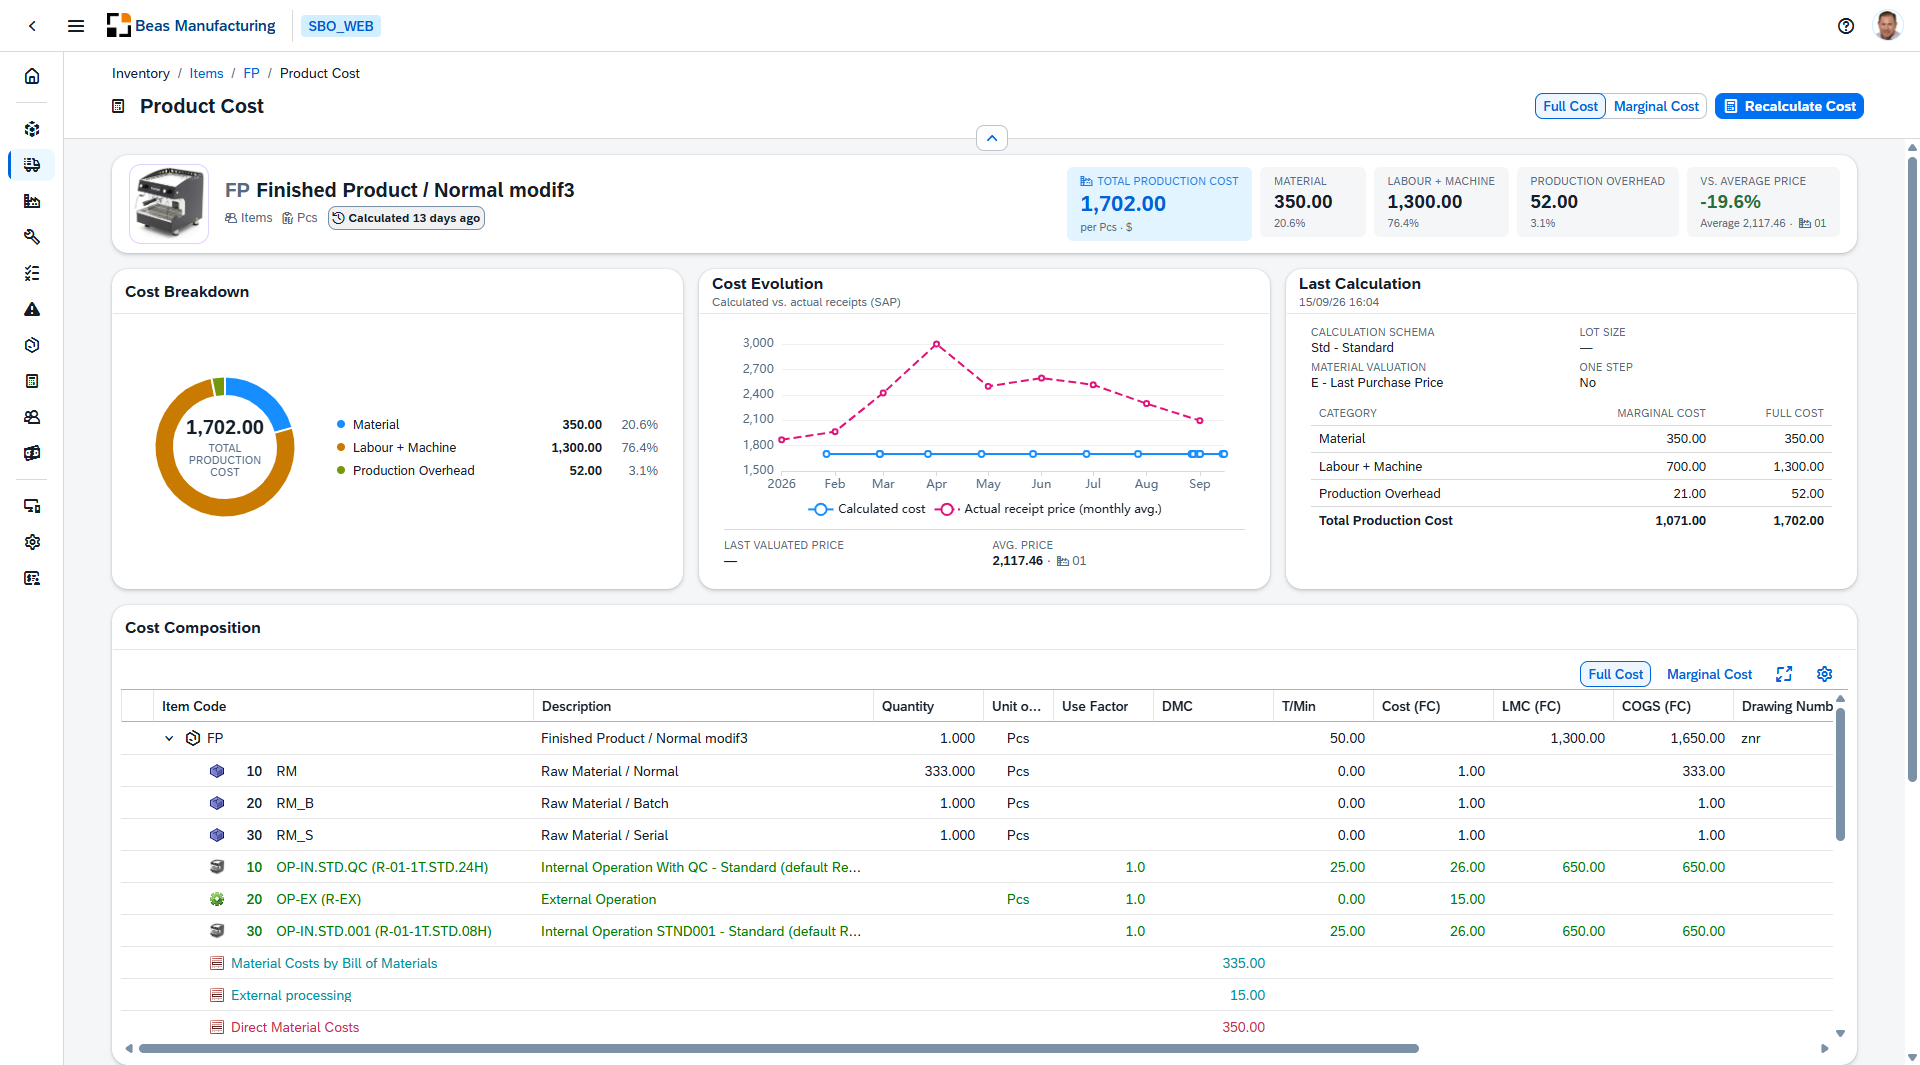
The page reads the result of a calculation that has already run — it does not calculate anything by itself. An item that has never been calculated shows No cost calculation with the message "This item has no calculated cost yet. Use Recalculate Cost to calculate it."
VIDEO demonstration:
Full Cost and Marginal Cost
The switch at the top right of the page selects which of the two readings every figure on the page uses:
| Reading | What it includes |
|---|---|
| Full Cost | The complete cost, production overhead included. |
| Marginal Cost | The cost without production overhead. |
Both readings come from the same calculation, so switching between them changes the numbers but never the layout — no card appears or disappears. The Cost Composition card carries its own Full Cost / Marginal Cost switch for its grid.
Your column layout in the Calculation History grid is kept independently of this switch, so moving between Full Cost and Marginal Cost does not reset your columns.
Item Header Card
A header card identifies the item and shows five key figures.
Item Information — the item code and description, its item group, its inventory unit of measure, and a Calculated tag giving how long ago the last calculation ran (hover it for the exact date and time).
KPI Boxes
| KPI | Description |
|---|---|
| Total Production Cost | What the run costs to produce the item, in the active reading — the calculation's production cost, not its net price, which adds the schema's mark-ups on top. The sub-line shows the unit and currency the figure is expressed in (per {UoM} · {currency}). |
| Material | The material portion of the cost. The sub-line is its share of the Total Production Cost. |
| Labor + Machine | The labor and machine portion of the cost, with its share below. |
| Production Overhead | What is left of the Total Production Cost once material and labour are taken out, with its share below. |
| vs. Average Price | The calculated cost compared against the item's average price in SAP, in percent. The sub-line names that average price, and the warehouse it was read from when it came from one. |
On vs. Average Price the sign and the color deliberately disagree: costing above the average price is the unfavorable direction, so a positive percentage is shown in red and a negative one in green. The box shows a dash when the item has no average price to compare against.
Cost Breakdown
A donut chart splitting the Total Production Cost into its three categories — Material, Labor + Machine and Production Overhead — with the total in the center. The legend beside it repeats each category with its amount and its share of the total.
When the calculation produced no cost values, the card shows No cost values to break down.
Cost Evolution
A line chart plotting the item's cost over time, subtitled Calculated vs. actual receipts (SAP).
| Line | Description |
|---|---|
| Calculated cost | One point per calculation run of this item — the production cost the engine arrived at each time, the same figure the Total Production Cost box shows. |
| Actual receipt price (monthly avg.) | The average price of the item's real goods receipts in SAP per month — what the item actually cost. |
Below the chart, two reference figures are shown for the item: Last Valuated Price and Avg. Price.
The chart plots at most the latest 24 calculations. When an item has more, the subtitle changes to say that only the latest calculations are shown, and older runs are left out of the chart. The Calculation History table below still lists every run.
The actual-receipt line is a comparison, not the reason the page exists. If the movement data cannot be read, that line simply stays empty and the rest of the page still loads.
Last Calculation
This card explains how the figures were produced. Its subtitle is the date and time of the run.
| Field | Description |
|---|---|
| Calculation Schema | The calculation schema that produced the figures. |
| Lot Size | The item's configured calculation lot size the figures are based on. |
| Material Valuation | Which price the calculation valued materials at (see Material Valuation). |
| One Step | Whether the calculation was run as a one-step calculation. |
Below the fields, a summary table repeats the cost categories in both readings side by side, so you can compare them without touching the switch:
| Column | Description |
|---|---|
| Category | Material, Labor + Machine, Production Overhead, and Total Production Cost. |
| Marginal Cost | The category's amount without production overhead. |
| Full Cost | The category's amount including production overhead. |
Cost Composition
The full structure of the calculation as an expandable tree — the item at the top, its components and operations beneath it, and the calculation's summary lines at the bottom.
| Column | Description |
|---|---|
| Item Code | The component item, or the operation code for an operation line. |
| Description | The component or operation description. |
| Quantity | The quantity of the component that goes into the item. |
| Unit of Measure | The unit the quantity is expressed in. |
| Use Factor | The usage factor applied to the line. |
| DMC | Direct material cost of the line. |
| T/Min | Time in minutes for an operation line. |
| Cost (FC) | The line's cost. |
| LMC (FC) | The line's labour and machine cost. |
| COGS (FC) | The line's cost of goods sold. |
| Drawing Number | The component's drawing number. |
| Match Code | The component's match code. |
| DIN | The component's DIN reference. |
| Material Group | The component's material group. |
| Raw Material | The component's raw material reference. |
This card has its own Full Cost / Marginal Cost switch, and the usual grid controls.
When the calculation stored no structure, the card shows This calculation stored no structure.
Top Cost Drivers
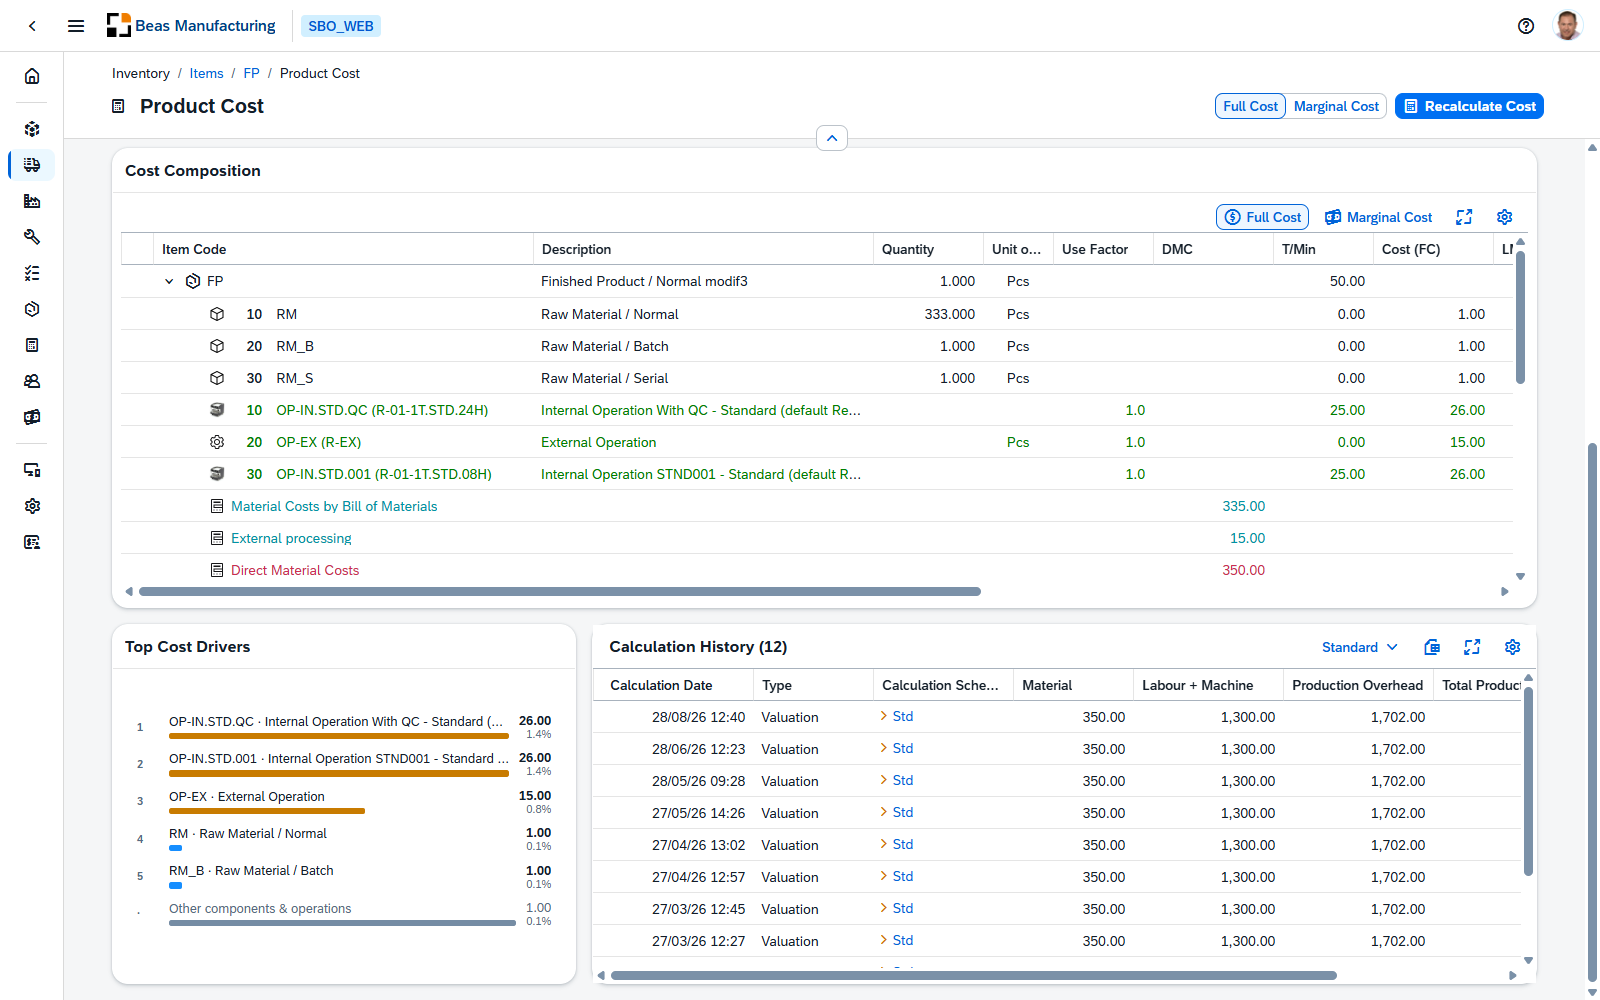
The five costliest single lines of the calculation, ranked, each with its amount, its share of the Total Production Cost, and a bar drawn relative to the biggest driver. Only component and operation lines are ranked — the item itself and the calculation's summary lines are totals, so including them would rank a line against itself.
Everything the top five leaves out is added as a final muted row, Other components & operations, so the listed percentages do not read as the whole cost.
When there are no cost lines to rank, the card shows No cost lines to rank.
Calculation History
Every calculation run for this item, newest first. The figures follow the page's Full Cost / Marginal Cost switch.
| Column | Description |
|---|---|
| Calculation Date | Date and time the run was calculated. |
| Type | The type of the calculation. |
| Calculation Schema | The schema that ran. Click it to open the calculation schema. |
| Material | The material cost of that run. |
| Labor + Machine | The labor and machine cost of that run. |
| Production Overhead | The run's production cost less its material and labor. |
| Total Production Cost | The run's production cost. The header names the active reading, because the switch changes every figure in the row. |
| Δ vs Prev. | How much the total moved against the previous run, in percent, with a trend arrow. Empty on the oldest run — there is nothing before it to compare against. |
As on the vs. Average Price box, an increase is the unfavorable direction: a rising total is shown in red, a falling one in green.
Recalculating the cost
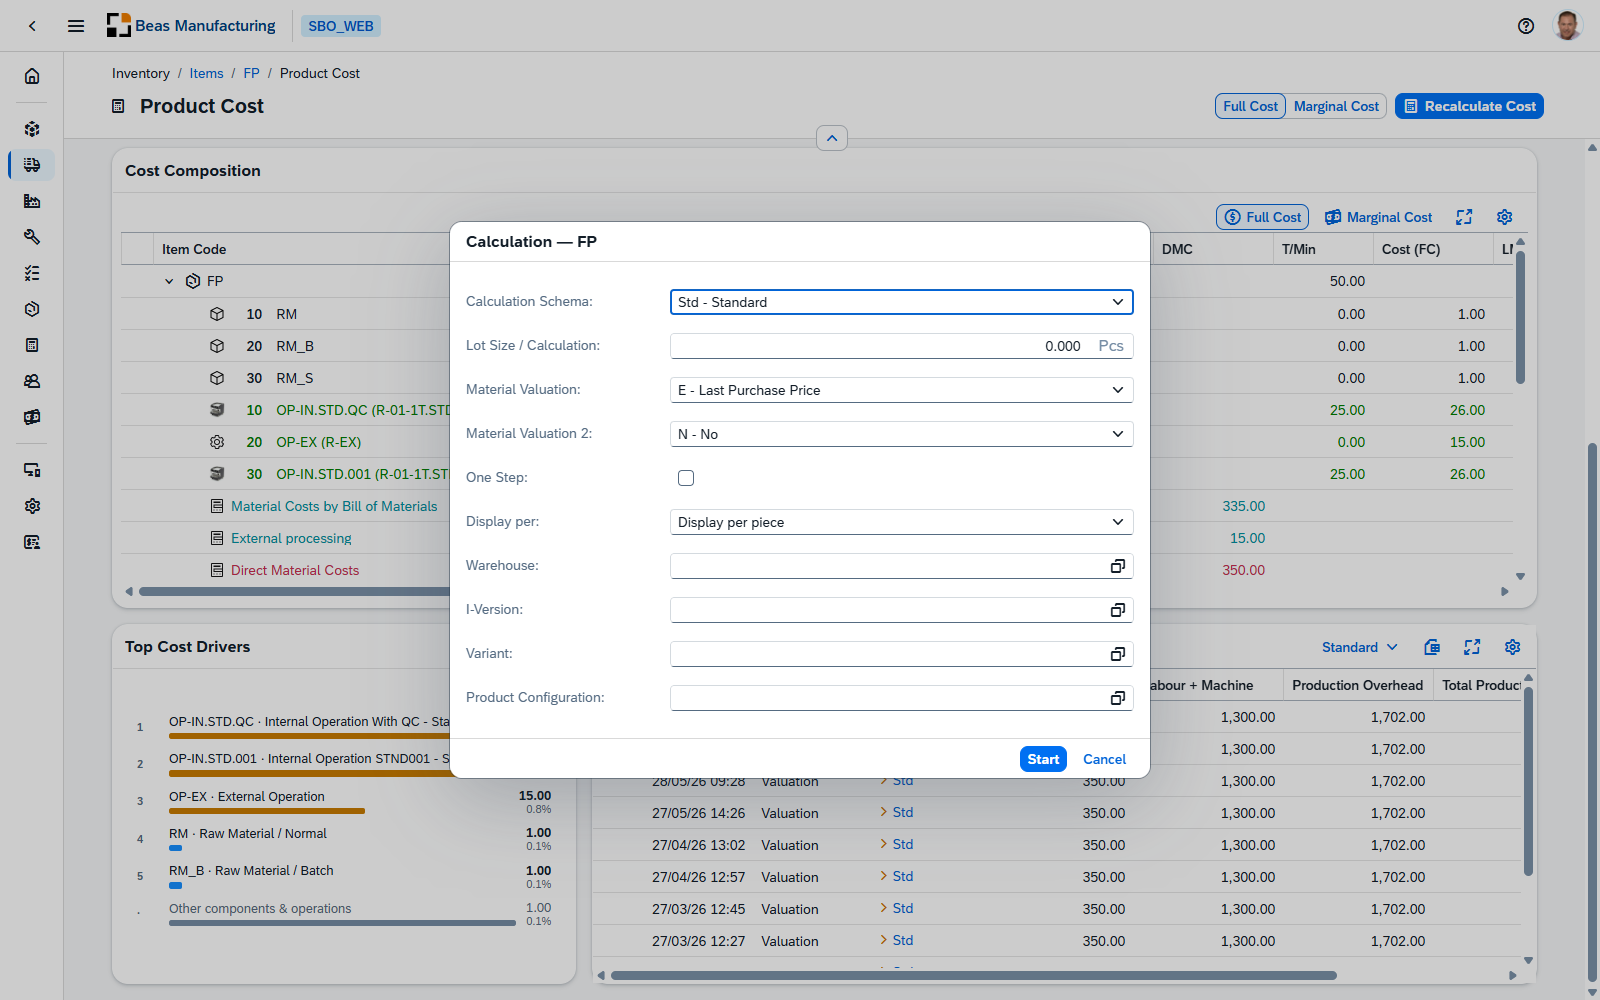
Recalculate Cost, at the top right of the page, opens the Calculation dialog for the item. The dialog opens on the settings the item was last calculated with, so running it again with no changes repeats the previous calculation.
| Field | Description |
|---|---|
| Calculation Schema | The schema to calculate with. |
| Lot Size / Calculation | The lot size the calculation is based on, in the item's production unit (shown beside the field). |
| Material Valuation | Which price materials are valued at (see below). |
| Material Valuation 2 | A second valuation, calculated alongside the first. Select N - No to calculate only one. |
| One Step | Calculate in a single step instead of resolving the structure level by level. |
| Display per | Whether the resulting figures are shown per piece, per lot size, or per display quantity. |
| Warehouse | Restricts the calculation to a warehouse. Leave empty for all. |
| I-Version | The item version to calculate. |
| Variant | The variant to calculate. |
| Product Configuration | The product configuration to calculate. |
Click Start to run the calculation, or Cancel to close without running. When the run finishes, the page reloads with the new figures and the new run appears at the top of the Calculation History. If it fails, the message The calculation could not be completed. is shown and nothing is changed.
Running a calculation stores the dialog's settings as the item's calculation definition — the next time you open the dialog, it opens on these values. Lot Size, Display per and Product Configuration are the exception: they apply to this run only and start neutral every time.
Material Valuation
Both valuation fields offer the same fixed codes, followed by the price lists defined in SAP.
| Code | Materials are valued at |
|---|---|
| K | Calculation price |
| E | Last Purchase Price |
| P | Last Valuated Price |
| D | Item valuation method |
| N | No — only on Material Valuation 2, to calculate a single valuation |
Selecting a price list instead of a code values the materials at that list's prices.
When an item has never been calculated, the two valuation fields open on the company defaults configured in Beas rather than on an item setting.
Refreshing data
The page loads when it is opened and reloads after a calculation finishes. To pick up a run started elsewhere — for example a batch calculation covering this item — reopen the page.
Permissions
| Action | Requires |
|---|---|
| Opening the Product Cost page | Read on Product Cost. |
| Opening the Calculation dialog | Read on Calculation. |
| Running a calculation (Start) | Full Control on Calculation. Without it, Recalculate Cost is not shown. |
Tips
Use Top Cost Drivers as the entry point when a cost looks wrong: it names the single component or operation carrying the cost, so you know which line of Cost Composition to expand first.
Compare the two lines in Cost Evolution before trusting a calculated cost. A calculated line that sits well below the actual receipt prices usually means the materials were valued at a price that no longer reflects what you pay — change Material Valuation and recalculate.
Switch to Marginal Cost to see what the item costs without production overhead — useful when judging whether an additional order is worth taking.