Work Order - Calculation
The Calculation view compares plan with reality for one Work order position. It puts the planned values and the actual ones side by side, line by line down the calculation schema, so the difference can be read where it arose rather than as a single total.
The view reports; nothing here is edited.
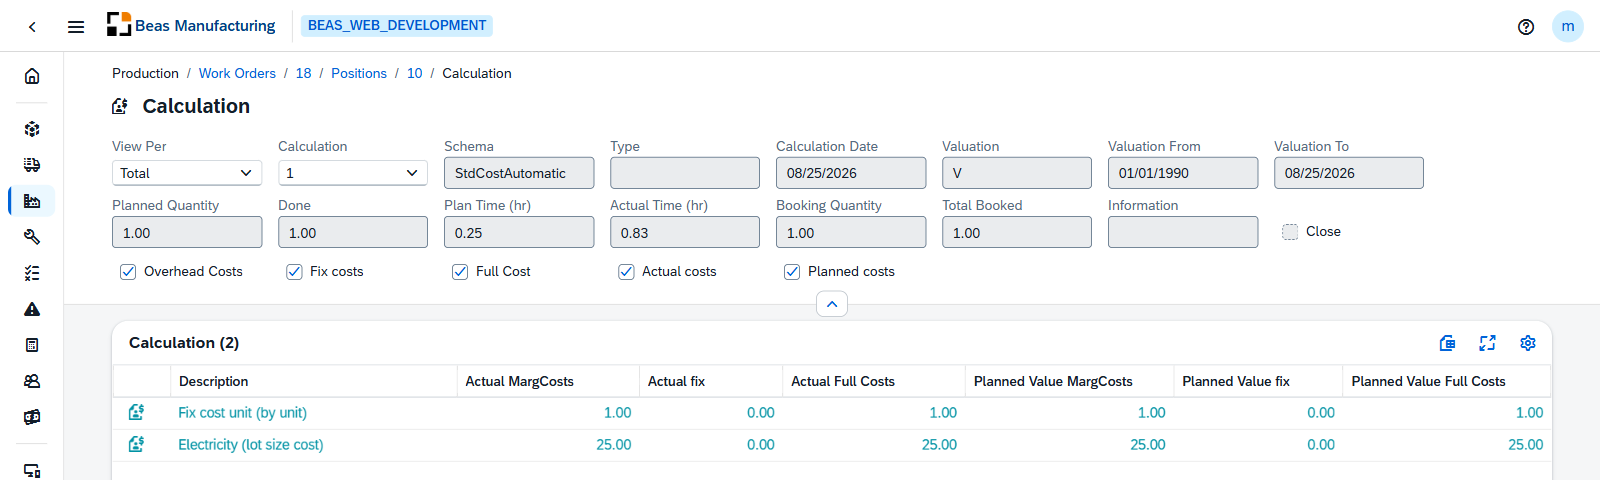
The calculation header
The header of the calculation that produced the figures:
| Field | Description |
|---|---|
| Schema | The calculation schema used. |
| Type | The calculation's type. |
| Calculation Date | When it was calculated. |
| Valuation | The valuation applied. |
| Valuation From | Start of the valuation period. |
| Valuation To | The end of the valuation period. |
| Planned Quantity | The quantity planned. |
| Done | The quantity actually made. |
| Plan Time (hr) | The time planned, in hours. |
| Actual Time (hr) | The time actually taken. |
| Booking Quantity | The quantity of the booking. |
| Total Booked | The quantity booked in total so far. |
| Information | Free text on the calculation. |
| Close | Whether the calculation is closed. |
Where several calculations exist for the position, each is shown with its own header.
The cost lines
The schema's lines, with what each was planned to cost and what it actually cost:
| Column | Description |
|---|---|
| Calculation | The line of the schema. |
| Planned Value MargCosts | Planned marginal cost. |
| Planned Value fix | Planned fixed cost. |
| Planned Value Full Costs | Planned full cost. |
| Actual MargCosts | Actual marginal cost. |
| Actual fix | Actual fixed cost. |
| Actual Full Costs | Actual full cost. |
| Standard | The standard value. |
Overhead Costs switches the overhead lines into the view; without it the comparison shows the direct costs only.
View Per
The figures can be read at four scales, and the same calculation looks very different in each:
| Value | What the figures mean |
|---|---|
| Per 1 Unit | Cost of a single piece. |
| Per ... Units | Cost per the number of units you choose. |
| Lot Size | Calculation | Cost per the lot the calculation was made for. |
| Total | Cost of the whole position. |
Examples
A cost overrun that is really a quantity difference. Planned Quantity and Done are on the header for a reason. A position that made more than it planned costs more in Total and may cost exactly the same Per 1 Unit — read the per-unit view before calling it an overrun.
Marginal against full, in the same table. Each cost line appears three times on each side: marginal, fixed, and full. Comparing a planned full cost against an actual marginal one is the most common way to reach a wrong conclusion here; keep to one column pair down the whole schema.
Nothing to compare. A position with a plan and no bookings shows planned values and empty actual ones — the calculation exists, the work has not happened yet. Done and Total Booked on the header say which case you are looking at.