You get to the Dashboard editor from the Add-widget button in the lower right or via Administration > Add-ons > B1 Usabiltiy Package > Module configuration > B1 Dashboard > Edit Dashboard Widgets
Out of the box you get the following out of the box Dashboards
NB: Beas dashboards only appear if you also are running Beas Manufacturing (version 9.3 PL02 or higher); For more info and support on the Beas Specific Dashboards please go here
NB: WMS dashboards only appear if you also are running Produmex WMS (version 2021.12 or higher); For more info and support on the WMS please go here
NB: Boyum Cloud Apps dashboards only appear if you also are running Boyum Cloud Inspect; For more info and support on the Boyum Cloud Apps please go here
Element |
Description |
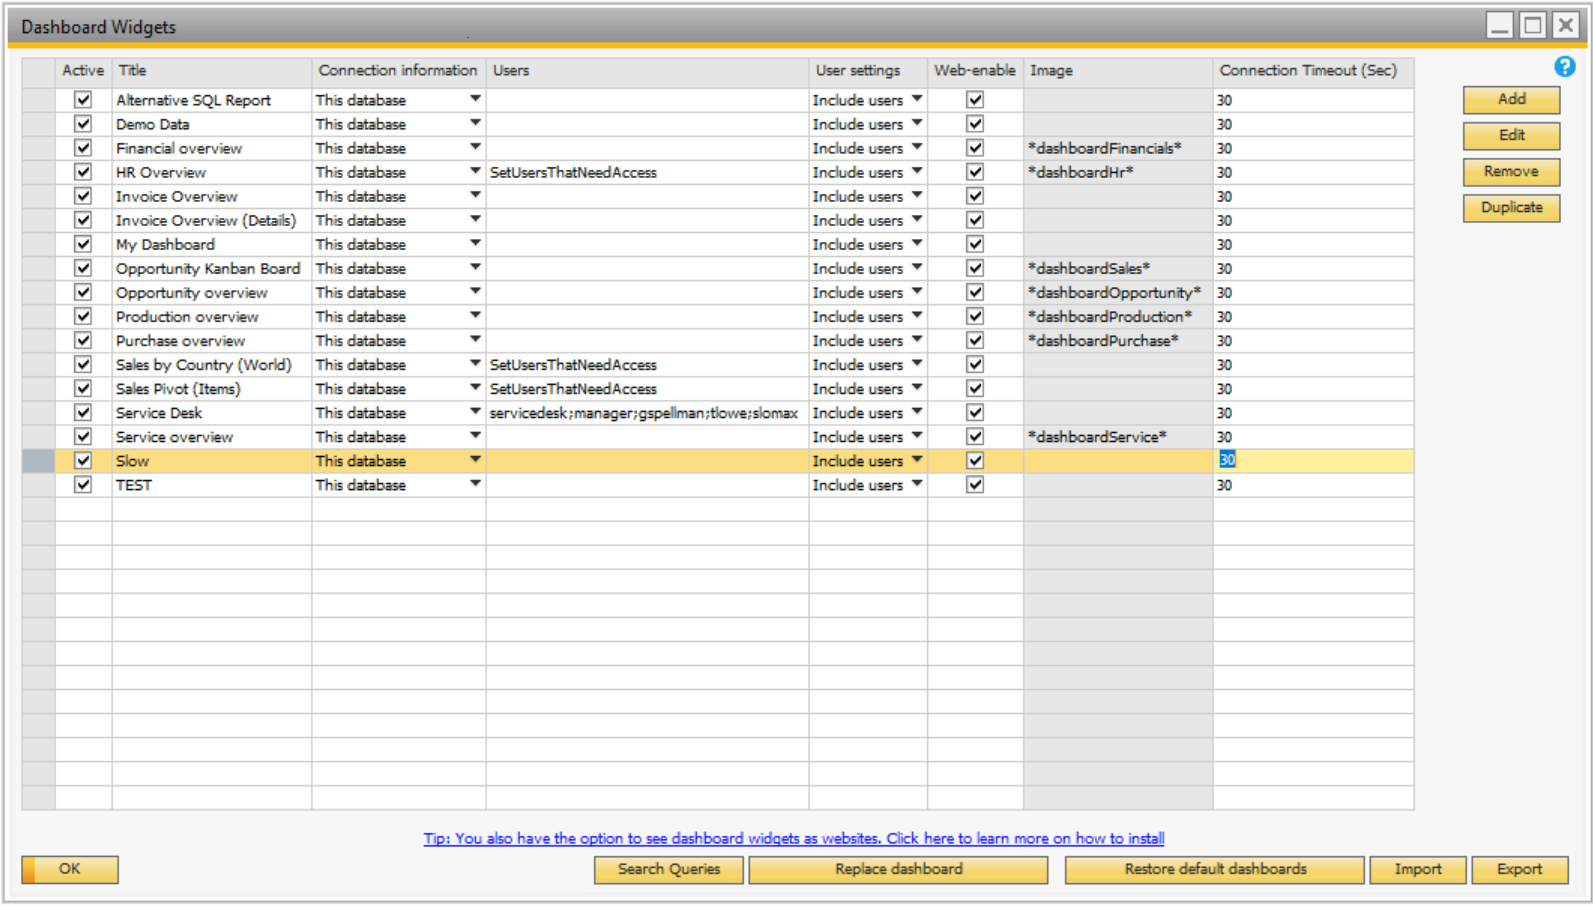
Title |
Here you define the title of you dashboard. It is this title that will be displayed on the Add widget screen and the title of the widget once displayed |
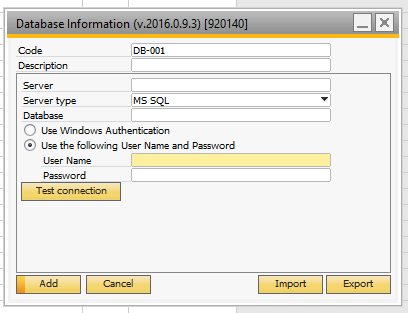
Connection information |
By default all dashboards assume it should execute their SQL in the database they are in. You can however override that and let a dashboard get its data from a different database/server. You do this by defining a new set of connection info:
|
Auto refresh |
You have the option to specify that a dashboard should automatically refresh on a fixed interval. |
Users/User settings |
By default when you create a dashboard everyone of your users are allowed to add it to their personal B1 Dashboard area. If some of you dashboards are only intended for certain users (for security or usability reasons) you can define while users that should be included/excluded to see this dashboard. Tip: You double-click this cell to get to the User-selection screen |
Image |
If you double-click this cell you can select an image to represent your dashboard in the Add widget screen. |
Web-enabled |
The web-enabled feature is use to tell if a dashboard should be visible in the web based B1 dashboards. You can download the installer of the Web Dashboards here |
Connection Timeout |
NB: (Only shown on systems running MSSQL, On HANA it is not needed) By default all connection in a dashboard have a max of 30 seconds to get it's data (and if not retrieved within that time-frame will get a timeout). In rare cases with extreme amount of data or very complex data it might be needed to raise that timeout and that is what this column allows you to do. Us simply set the number of seconds you want the extended timeout to be.
NB: Please note that in order for the new timeout to take effect, you need to open the editor and save the dashboard (no need to change anything) before the new setting takes effect.
NB: Please note that the timeout is not possible to adjust in Web-dashboards so this will only help on MSSQL inside the Web-client. |
Add/Remove/Edit/Duplicate |
Here you can add new dashboards or remove/edit/Duplicate the highlighted dashboard.See dashboard editor for more information |
Restore default dashboards |
If you have removed some of the out of the box dashboards we deliver you can press this button to get them back |
Replace dashboard |
Replace a dashboard with another one |
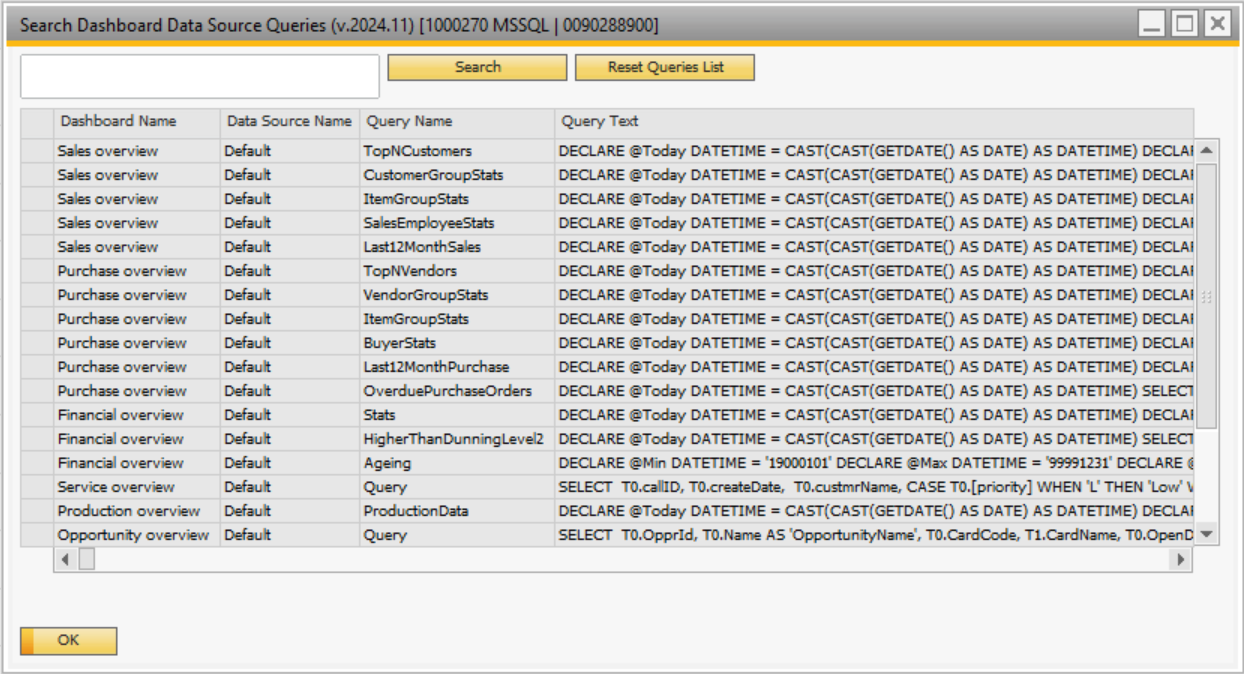
Search queries |
Search all queries that are used in your dashboards
Double-click the query text column in order to copy the whole query to your clipboard.
|
Import/Export |
Here you can import and export your dashboard layout as XML. |
It is possible to also have the dashboard widget in a Web Browser by installing the additional B1WebDashboard component on your server.
More information: https://youtu.be/aFBKeHt1y-4
Download the installer for the Web dashboards (Install Guide inside): https://download.boyum-it.com/b1up/b1webdashboard