The Dashboard editor is the tool to create new and edit existing layout.
NB: While the editor is very intuitive it is a super-user tool and require training and SQL knowledge to use. Boyum Solutions offer simple help on the editor but advanced editing is considered premium services help: www.boyum-it.com/Link/
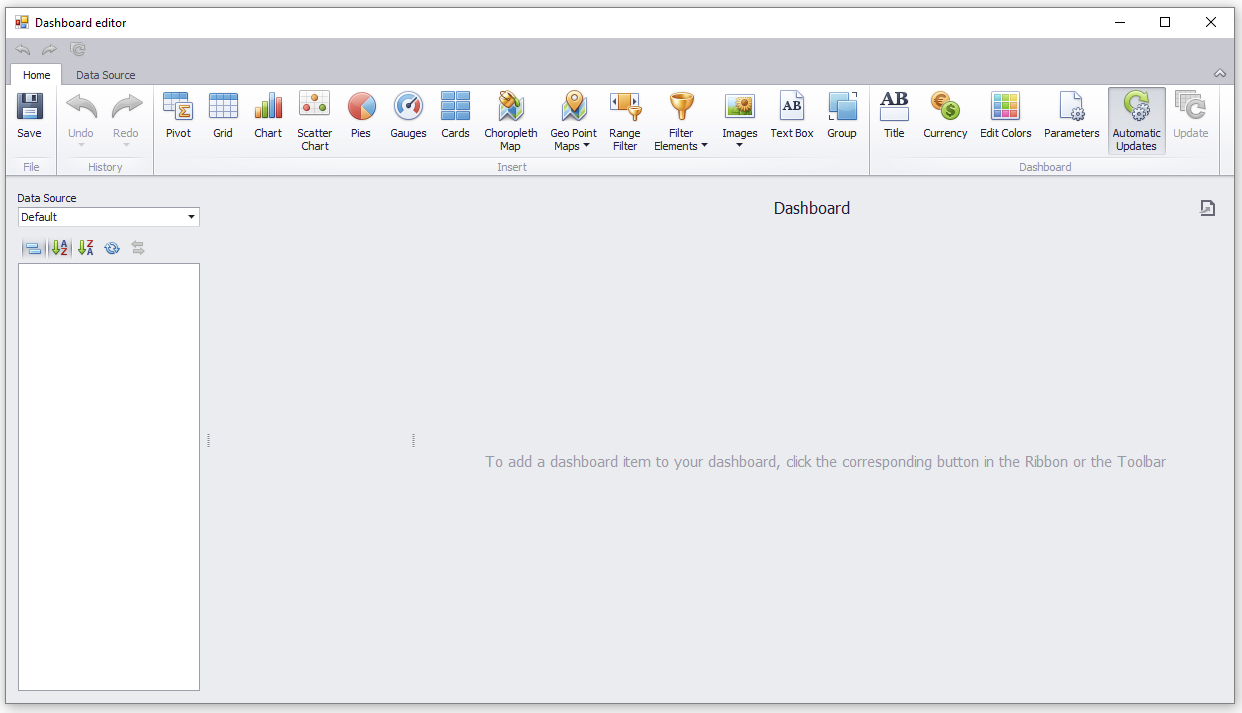
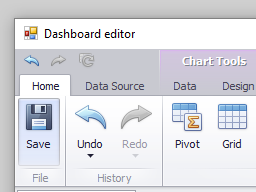
This is how the editor looks like the first time you start
Below is a simple step by step sample to get you going. For Additional info and e-learning go to: http://www.boyum-it.com/Link/B1Dashboard:
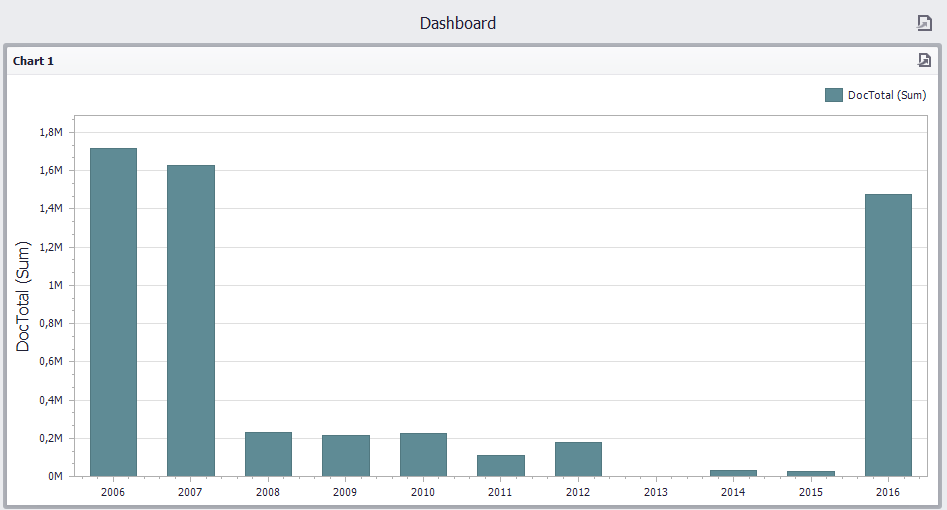
Step by step sample of a simple sales over time dashboard
NB: This dashboard is pretty expensive in big databases but kept this way to keep it as simple as possible. Please check link above an the article on performance vs flexibility in the editor
1. Click on Data Source at the top
2. Click on Add Query
3. In the Query window write the following SQL: SELECT DocDate, DocTotal FROM OINV
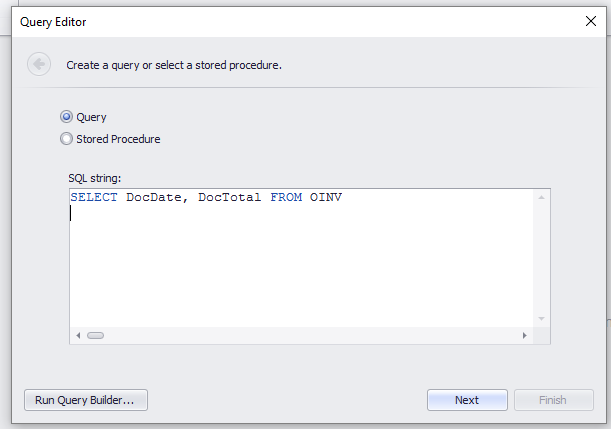
4. Click Next and Finish (You now have you first datasource)
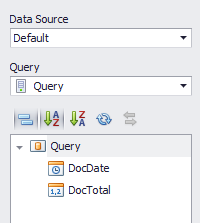
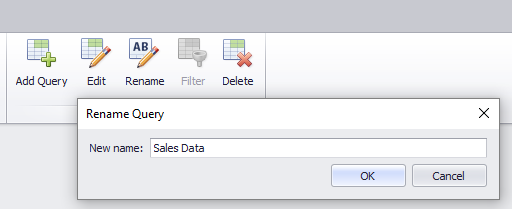
5. Rename the Datasource "Sales Data" (Optional)
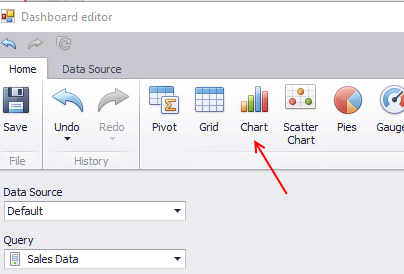
6. Press "Home" at the top and choose "Chart"
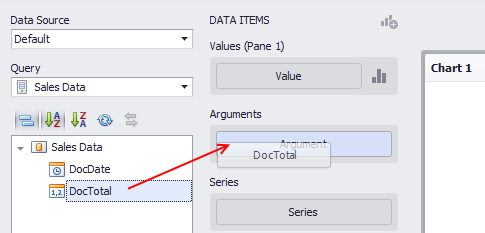
7. In the Data Dimensions Drag "DocDate" in as argument (X-axis)
8. Now drag "DocTotal" in as Value (y-axis)
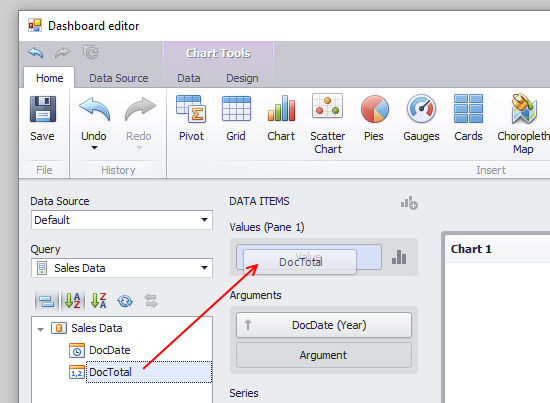
9. Your chart should now show data (look different depending on the data of cause)
You can press save now and add the widget to you dashboard now or do the below extra steps to make it more dynamic/pretty
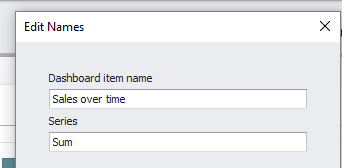
10. Right click the chart and choose "Edit name" to change the names of the elements
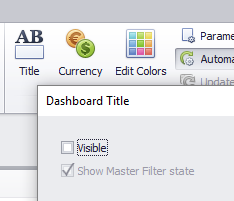
11. Choose Title in the Ribbon and uncheck visible (best fit for B1 Dashboard)
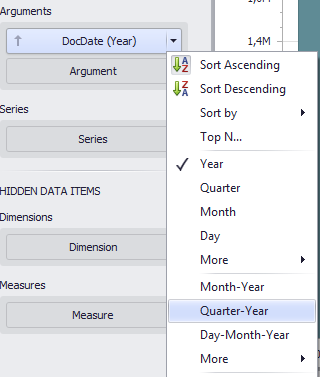
12. On the argument Choose 'Quater-Year' instead of 'Year'
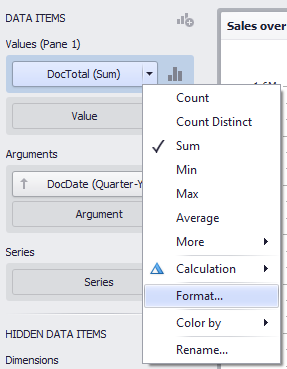
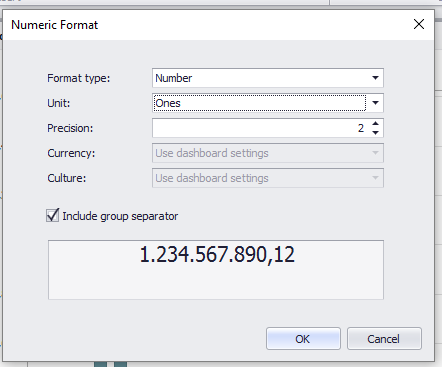
13. On the values Choose format to format the numbers to you taste
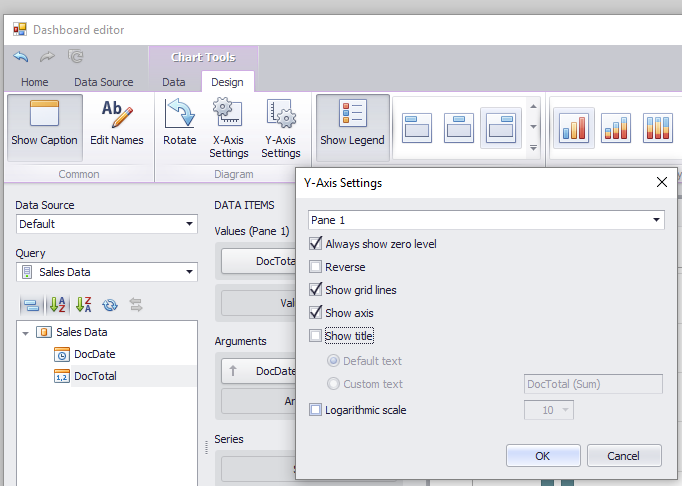
14. On chart tools > Design remove the title of the Y-Axis
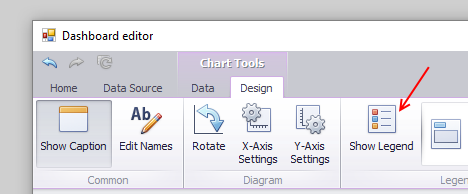
15. Remove the Legend
16. On the "Home" tab press the "Save button"
You are now done with you first dashboard and can add it onto the dashboard area
Additional features:
- You can set the grids of a dashboard widget to show auto-filter rows. This is done by clicking the button "Show Auto-filter rows" in the Editor, save and update the parent form
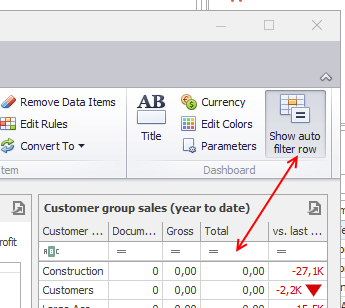
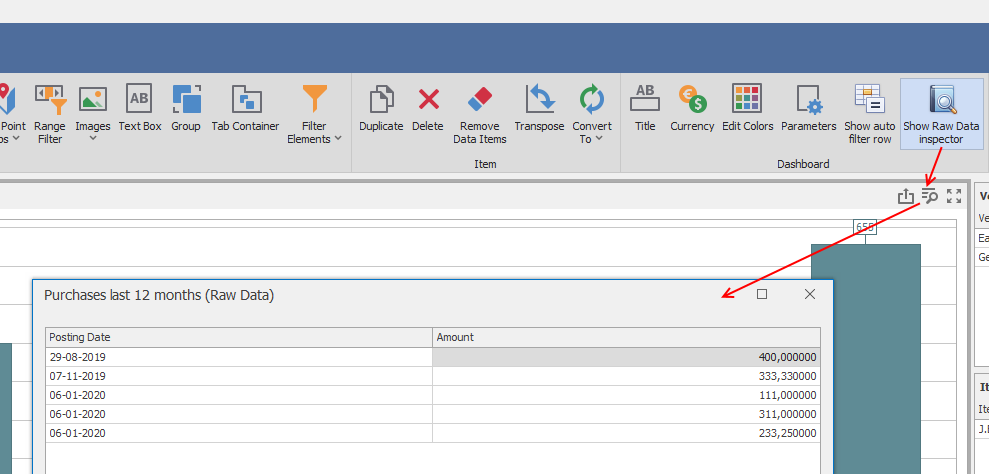
- You can all components to show a Data Inspector that allow the user to show details on the underlying data. This is done by clicking the button "Show Auto-filter rows" in the Editor, save and update the parent form